

Branches. This page describes the Flutter app on the
typography branch of LMS_Frontend
(commits 8508cf3 “Add staff typography and laptop layouts” and 8f6ada4 “Improve staff sidebar
sizing”), not the chat+ai branch this site is built from. The staff type scale (StaffType), the
staff theme (StaffThemeScope) and the 13-inch layouts it mentions are only on typography until
that branch is merged.Status: DONE ✅ (01/11/2026, Update 186 in the frontend log, on
LMS_Frontend typography, not
committed yet). Steps 1a, 1b, 2 and 3 below are in the code. Sidebar labels stay at 15px; the
staff minimum is a 1280px wide browser window. Measured results in §4.Student side. The same kind of test on the student side (guest, login, after login), run on
06/11/2026, is in §5.
0. TL;DR
- The staff typography is not what makes the app feel slow. The same scripted admin session takes the same main-thread time on the commit before it and on the commit after it (§1).
- The lag comes from the automatic sidebar collapse. Opening Orders, Platform Configuration, Settings or the quiz editor collapses the sidebar, and leaving them opens it again. During the 200ms width animation, the app lays out every page visited since sign-in again on every frame. Each collapse or re-open blocks the main thread for about 1–1.2s in a debug build; a normal page switch costs about 80ms.
- The fix: hidden pages keep their size (1a), the sidebar no longer collapses on its own (1b). With 1b alone, the Orders round trip drops from 2.4s of blocked main thread to 0.1s.
- Also in this plan: fixed font sizes in the sidebar (2), and a “use a bigger screen” page for staff on browser windows narrower than 1280px, reusing the phone notice without the app store links (3).
1. What was measured
The same admin session was run on two copies of the app, in a debug build likeflutter run,
against a local backend with seeded data, in headless Chrome at 1440 × 800:
- sign in as an admin and wait for the dashboard;
- scroll the dashboard down and up;
- click 7 sidebar entries (Trainings, Quizzes, Users, Orders, Classrooms, Discounts, Dashboard), then the same 7 again. The first pass builds each page; the second only switches to it.
1.1 Before and after the staff typography
- The difference is within the run-to-run noise.
- The theme code added by the update (the staff theme, theme look-ups, the auto-sized sidebar labels) is well under 1% of the busy time.
StaffType.title3and the other scale values arestatic const: the compiler writes the number in their place, so they cost nothing at run time.- At 1728 × 1000 (a 16-inch MacBook), the after build measured the same as at 1440 × 800: the screen size is not a factor either.
1.2 Where the time goes
The staff shells keep every visited page alive (go_router’s
StatefulShellRoute.indexedStack: an
IndexedStack of Offstage branches). An offstage page is not painted, but it is still laid out
whenever the body’s width changes. The sidebar animates its width over 200ms, so each frame of the
animation lays out all the visited pages again, and the pages built with a LayoutBuilder (the
dashboards, the tables) are rebuilt as well.
This also explains the lag felt on the dashboard: coming back to it from Orders or Settings
re-opens the sidebar, and the freeze happens while the dashboard is on screen. Scrolling the
dashboard itself has no long task in any build.
Every number on this page comes from a debug build, which runs unoptimised code with all the
framework checks on, several times slower than a release build. To judge the real speed, run
flutter run -d chrome --profile (or --release).2. The plan
1
1a. Hidden pages keep their size
A new branch container in
lib/ui/widgets/ (Flutter widgets only, no new package): a page
that is not on screen keeps the size it had when it was last shown, so a sidebar animation or a
window resize lays out the visible page only. The staff shells (admin, instructor, content
manager, super admin, platform configuration) use it through
StatefulShellRoute(navigatorContainerBuilder: ...). The student shell does not change.2
1b. No automatic sidebar collapse
SideBarWidget.checkAndUpdateSidebar no longer collapses the sidebar when a page opens; the
chevron in the sidebar header still collapses it by hand. The pages it was collapsed for are
checked at 1280 × 650 with the sidebar open (248px): Orders and order details, Platform
Configuration (it has its own 280px sub-menu), Settings, the quiz editor and the quiz preview.
Any that does not fit is fixed.3
2. Fixed font sizes in the sidebar
sidebar_widget.dart writes its sizes as numbers instead of reading the staff scale: entries
15px (w500, w600 when selected), the company name 22px. It looks the same as today. 16px (the
size before Update 184) is not used: “Platform Configuration” does not fit the 180px label
column at that size. The row height logic (44px, down to 36px in short windows) stays.4
3. A 13-inch minimum for staff on the web
MobileViewportNotice (the phone notice) also covers staff: on the web, when an instructor,
content manager, admin or super admin is signed in and the window is narrower than 1280px
(a maximised window on a 13-inch Windows laptop; 13-inch MacBooks are 1440–1470px), it shows
the same screen with a laptop drawing, a “make this window wider” text in English, French and
Arabic, and the window’s current width. No App Store or Google Play badges, no voucher line.
Students keep the 600px phone notice. The page underneath stays alive, so widening the window
brings back exactly where the user was. The native apps are not affected.5
4. Checks
Widget tests for the branch container, the notice (students at 599 / 600px, staff at
1279 / 1280px, no store badges for staff, page kept) and the 15px sidebar labels;
flutter analyze; the full test suite; the timing script of §1 again; screenshots of the
notice and of the pages re-checked in 1b. Then LMS_Frontend/CLAUDE.md and a new entry in
major_code_updates.md.3. Decisions (01/11/2026)
4. Result (01/11/2026)
The same session as §1, on the code with all four steps:
What step 1b needed on the pages the sidebar used to collapse for (35 screenshots at 1280 × 650, admin,
instructor and super admin, sidebar open):
- Orders: the column minimums went from 1,156px to 980px to fit the 982px table. The System Log button now says “View” (“Preview logs” is its tooltip). The buyer e-mail column is the one that gives at 1280px; it gets most of the extra width on bigger screens.
- Quiz and exam editor: the step bar no longer hides its fourth step (long captions end in ”…”), and the four answer types go two by two when four in a row would cut their names.
- Settings (staff only): the settings menu is 310px wide instead of 350px, so the forms keep their margin. Students keep 350px.
- Platform Configuration, order details, the instructor’s public profile pages and the dashboards fit as they were.
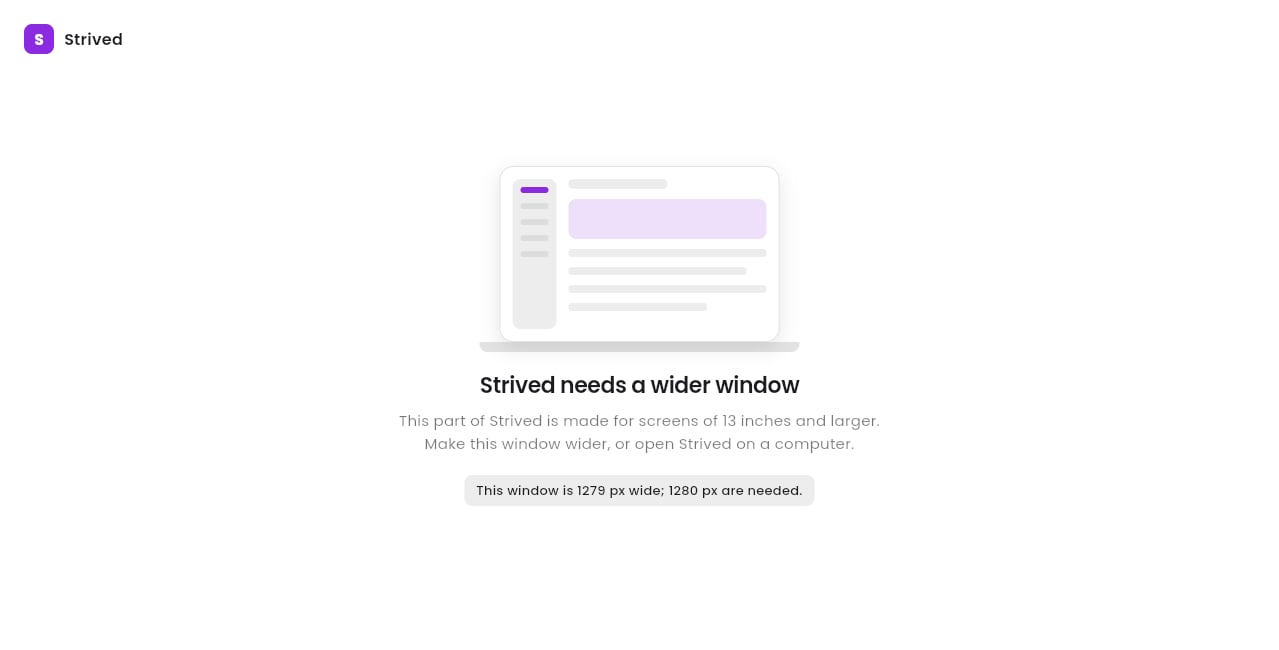
The staff notice at 1279px: no store badges, the window's current width.
5. Student speed test (06/11/2026)
The same kind of scripted session as §1, on the student side: a guest opening the app, the login, then everything after it. Measured onLMS_Frontend chat+ai at 02ca25f and LMS_Backend at
51153e7.
Nothing in this section is in the app yet. The fixes of §5.5 were tried on a throwaway copy, to
get measured numbers.
LMS_Frontend and LMS_Backend did not change.5.0 TL;DR
- Moving around the app is fast. A first click takes 83 ms at the median on a fast Mac and 158 ms on a slower laptop on 4G. The longest freeze on a page switch is 291 ms, and a revisit never freezes for more than 113 ms. There is no sign of the staff sidebar problem.
- The slow moment is the very first visit. The login form appears after 1.7 s on the Mac, 4.0 s on TEST over a real connection, and about 8.6 s on the slower laptop on 4G (9.6 s on the real TEST server, §5.2.1). The three-dot loader shows within a second, so it is a wait, not a blank page.
- The tested fixes bring 8.6 s down to 6.8 s (§5.5), or 9.6 s down to 7.1 s with TEST’s real data (§5.2.3). Reaching 4–5 s on that slow profile needs a bigger change (§5.6).
- One real bug. The boot loader is never removed, so the browser redraws 60 times a second for as long as the app is open, on every page (§5.4). The fix is three lines.
5.1 How it was measured
The app has no guest catalog: every/student* route sends a visitor who is not signed in to /login.
So a guest can only reach the login, register and forgot-password pages. The public marketing site is
a separate site and was not tested.
Setup. A flutter build web --release copy served with Brotli and the same cache headers as TEST,
against a local copy of the backend on SQLite (no real user data, no call to TEST or PROD). Seed: 60
trainings, 30 exams, 10 instructors and one student who owns 6 trainings and 4 exams, with progress
on 3 trainings, exam attempts and 2 classrooms. Headless Chrome at 1440 × 800 on the Mac’s real GPU, a
fresh browser profile for each session, and three sessions per profile. Every number is the median.
Measures.
- On screen: when the content is there, read from a recording of the screen. A hint popping up or the last images fading in don’t count.
- Blocked: the sum of the browser’s long tasks, as in §1 (main-thread work over 50 ms, the time the page cannot react).
- Longest freeze: the biggest of those long tasks.
web/index.html on this branch and on TEST, and
marked “FOR PROD”. If PROD turns it on, its cost comes on top and is not measured. Turnstile cannot finish on a
local address.
5.2 Guest (not signed in)
- One of the three TEST visits took 8.2 s; the other two took 3.9 s and 4.0 s.
- The 8.0 s uses a better compression than TEST’s. With TEST’s compression it is 8.6 s, the number used from here on.
- A first visit shows the three dots within a second, even on 4G. The browser’s own “first contentful paint” says 7 s because it doesn’t count a loader drawn in CSS, so ignore that number here.
5.2.1 Every way a guest opens the app
Measured on the real TEST server (elearning-test.theteam.com.tn), not on a copy: three visits of
each, no login, nothing written to TEST. “Fast Mac” is an M3 Max on a real connection; “Slower laptop on
4G” is the same 4× slower CPU and Fast 4G as above.
The first table above used a local copy, without TEST’s login image and theme call. On the real TEST
server, the slower laptop on 4G takes 9.6 s, so that is the starting point for everything below.
- “Hot reload” is not on this list. It only exists for developers running
flutter run. A visitor’s equivalents are the refresh and the hard refresh. - Coming back after closing the browser costs about 1.6 s more than a refresh. Nothing is downloaded,
but the browser has to compile
main.dart.jsagain, with 2.4 s of blocked main thread. - A hard refresh is rare. It ignores the cache on purpose, so normal visitors don’t do it.
- The language barely changes anything. French and Arabic take the same time as English, within the run-to-run noise.
- The phone case is pure waste. A phone browser downloads the whole app, then shows one static page, “Strived works best in the app”, with the two store badges.
5.2.2 What a first visit does, in order
The real TEST server, slower laptop on 4G. A first visit makes 26 requests.
Three things stand out:
/platform/themeblocks a first visit. Returning visitors paint from a saved copy (platformThemeCache) and refresh it in the background. A first-time visitor has no saved copy, sobootstrapOncewaits for the network. The answer is six short values that rarely change.- The login image starts very late. It is requested 8 s into the visit, because its address is inside the theme answer.
- The login image is 5120 × 2880 pixels, for a panel of about 720 × 800. Decoded, that is about 59 MB of memory. This costs more than the 412 KB suggests.
5.2.3 Fixes tested on a guest’s first visit
Each row adds to the one above. Slower laptop on 4G, three visits each. Only the files being changed came from a copy; the theme API and everything else were the real TEST server. As a check, the copy with no fix took 9.85 s against 9.6 s on the real site, so the copy behaves like TEST.
That is 2.8 s off a first visit, 28%, all on Flutter CanvasKit. The first three rows need no Dart change
and already save 1.9 s.
5.2.4 Ideas for the login page
The login image. 90 KB is a good target, and it doesn’t cost visible quality, because the file is mostly
smooth color. The pixel size is what has to change: at 5120 × 2880, even JPEG quality 55 stays at 157 KB.
1920 × 1080 at quality 85 fits the 90 KB target and stays sharp on most laptops; upload the same file on
PROD. Decoded, it takes about 8 MB of memory instead of 59 MB. The test above used the 1600 × 900 file.
5.2.5 Plan for guests
1
1. Replace the login image (no code)
Export
4_auth_bg_blue.jpg as in the table above and upload it on TEST and PROD.2
2. Compress at deploy time (no app code)
Add Brotli level 11 to
.github/deployment/deploy_web_canvaskit_344.sh, including the .ttf and .otf
files, which TEST sends uncompressed, then turn on brotli_static in nginx. Whether the servers have that
module was not checked.3
3. Put the theme in index.html (no Dart change)
Have the deploy script read If an admin changes the colors, a first-time visitor sees the old ones until the background refresh repaints
them, and the next deploy updates the file. Reading the code, the repaint is already there; that case was not
run.
GET /platform/theme?company_id=1 and write the answer into web/index.html,
before the Flutter scripts. It fills the same platformThemeCache that returning visitors already use, so
the app paints at once and refreshes the theme in the background:4
4. Remove the loader and apply the rest of §5.5
The loader fix, the PDF viewer on demand, then a test with a real PDF lesson.
5
5. Show the phone notice in plain HTML
In
web/index.html, when the window is under 600 px, show the notice in plain HTML and don’t start Flutter,
so a phone visitor gets it almost at once instead of after 8.1 s and 5.4 MB. Start Flutter if the window
becomes wider. Not built or measured yet.6
6. Load the icon fonts after login
Keep Poppins and Material Icons in the first load, and load the others with
FontLoader after login.5.3 Signing in and after
The first two columns show when the content is on screen.- Revisits are close to instant: 44 ms at the median on the Mac and 49 ms on the slower laptop.
- Scrolling the dashboard has no long task and no slow frame on either profile (93 frames, the worst 17 ms).
- The slower pages wait for their images, not for the code. On the course player, a “Double-click to zoom” hint appears about 0.6 s after the content; that is not loading time.
5.4 What was found
1. The boot loader never goes away (bug).web/index.html has <div class="loader">, which pulses
with a CSS animation, and nothing removes it after the app starts. It stays under the app, invisible,
so the browser keeps producing frames forever. Removing it by hand confirmed the cause, on TEST too:
The cost is battery and fan noise on laptops rather than speed, and it runs for as long as the tab is
open.
2. Where the 8.6 s of a first visit goes (slower laptop on 4G, with TEST’s compression):
So there are two costs, the download and the start-up, and a smaller
main.dart.js is the only change
that cuts both.
3. main.dart.js is one 12.3 MB file with every role in it. There are no deferred imports, so a
student downloads the staff pages and every package on the login page, before seeing anything. The
staff pages are not the main weight, though. Measured from a source map:
The source map covers about 60% of the file; the rest is constants and type data, so read these as
proportions. The PDF engine stands out: only two files use it (
app_html_content.dart and
preview_training.dart), and most sessions never open a PDF.
4. A deploy is cheaper than it looks. A real deploy changes main.dart.js, not CanvasKit, the fonts
or the images, so a returning student downloads 3.4 MB, not everything. The next visit takes 5.0 s
on the slower laptop on 4G, against 8.6 s for a first visit.
5. TEST compresses main.dart.js weakly. TEST sends 3.36 MB, which matches Brotli level 3. Level 11
gives 2.45 MB, but takes about 15 s, so it has to be done once at deploy time, not by the server on
each request.
6. /certifications/by-user runs 11 times in one session. my_profile_screen.dart gives the
Certificates and Exam Attempts tabs a UniqueKey(), so Flutter treats them as new widgets on every
rebuild of the page, even while they are hidden, and the Certificates tab loads its data again. It is
“known issue 5” again, already fixed on the two neighbouring tabs. Students don’t feel the request: it
runs in the background, weighs about 500 bytes and takes 17 ms locally, or 173 ms on the 4G profile.
What they do feel a little is the rebuild, about 100 ms of blocked main thread on each tab switch on
the slower laptop.
7. TEST’s login image is 412 KB and 5120 × 2880 pixels. 4_auth_bg_blue.jpg comes from the backend,
against 135 KB for the image the local tests used. See §5.2.2 and §5.2.4.
Checked and fine. OPTIONS preflights are cached for 2 hours (max_age 7200, also on TEST), so they
are paid once per URL. A 515 ms freeze seen once on the Exam Simulator tab did not come back: 80 ms at
the median.
5.5 Fixes tried, with measured results
Each row adds to the one above. Slower laptop on 4G, three sessions each.
That is 1.8 s off a first visit, 21%. The remaining 6.8 s is about 4 s of download (CanvasKit alone is
1.7 MB and cannot shrink) and about 2.7 s of start-up on the slower CPU.
The PDF change moved 1.2 MB out of
main.dart.js into a separate file that the login page does not
download. Opening a real PDF lesson with it was not tested, and the change needs that check.
Loader. Tested: 0 frames per second and 0–0.1% main thread on every page, down from 60 and about
2.5%, with no flash at the moment the app takes over. In web/index.html, before
_flutter.loader.load():
createCertificateApi already adds it to the list through registerCreatedCertificate (read in the
code, not run). In my_profile_screen.dart:
5.6 Suggested order
1
1. Remove the boot loader
Three lines in
web/index.html. It fixes the bug in §5.4 and carries no real risk.2
2. Use stable keys on the two tabs
Two lines in
my_profile_screen.dart.3
3. Compress at deploy time
In
.github/deployment/deploy_web_canvaskit_344.sh, create .br files with Brotli level 11 after
the build, and turn on brotli_static in nginx. Whether the servers have that module was not
checked. This is the biggest single win, about 0.9 s, with no change to the app.4
4. Load the PDF viewer on demand
A small wrapper widget around
SfPdfViewer, used by the two files, then a test with a real PDF
lesson. Add the preload hints in web/index.html at the same time, and serve CanvasKit from our
own server: its Google URL changes with each Flutter version, so it cannot be preloaded.5
5. Shrink TEST's login image
4_auth_bg_blue.jpg, from 412 KB to about 90 KB, and the same on PROD. It has to be resized (§5.2.4).
On a fast computer with a good connection, the first visit is already about 4 s today: the slower
laptop on 4G is a deliberately harsh profile. The numbers a real student gets sit between the two.